
RBT Exam Study Guide – Unit A: Measurement (Section A of the RBT Task List)
Welcome to Unit A of our Free RBT Exam Study Guide, where we focus on the critical concept of measurement in Applied Behavior Analysis (ABA). This unit is based on Section A of the official RBT Task List (2nd Edition), which outlines essential skills Registered Behavior Technicians (RBTs) must master to accurately and ethically measure and report on client behaviors.
Practice your mock test here with latest updated rbt quizzes RBT practice exam
Understanding and implementing effective behavioral measurement techniques is a foundational part of the RBT role. Accurate measurement allows for objective data collection, progress tracking, and informed decision-making within ABA programs.
Topics Covered in This Unit on Behavioral Measurement:
- Prepare for Data Collection Learn how to review programs, gather materials, and ensure you’re ready to observe and record data in real time.
- Implement Continuous Measurement Procedures Explore continuous methods like frequency recording, duration tracking, latency, and rate measurement to capture every instance of a target behavior.
- Implement Discontinuous Measurement Procedures Understand sampling strategies like partial interval recording, whole interval recording, and momentary time sampling to monitor behavior within designated timeframes.
- Implement Permanent Product Recording Procedures Discover how to measure outcomes of behavior—such as completed homework or assembled items when direct observation is not feasible.
- Enter Data and Update Graphs Learn how to input behavioral data into data sheets, software, or apps, and how to maintain visual displays like line graphs that show progress over time.
- Describe Behavior and Environment in Observable and Measurable Terms Gain skills in using operational definitions that eliminate ambiguity, allowing any observer to identify the same behavior reliably.
Why Measurement Is Essential in Applied Behavior Analysis
In ABA, data drives everything. The systematic measurement of behavior is what allows practitioners to make data-based decisions—deciding whether interventions are working or if modifications are needed. Without reliable data, it is impossible to gauge progress, ensure accountability, or demonstrate the effectiveness of treatment.
As an RBT, you are responsible for collecting behavior data consistently during every client session. This data is then reviewed by Board Certified Behavior Analysts (BCBAs) or supervisors to assess the effectiveness of behavior intervention plans (BIPs), skill acquisition programs, and other ABA strategies.
Key Takeaways for RBT Certification Exam Prep:
- Know the difference between continuous and discontinuous measurement
- Understand how to collect and interpret permanent product data
- Be familiar with graphing and basic data visualization
- Always use objective, observable, and measurable terms when describing behavior
- Recognize how your data supports client outcomes and ethical practice
Mastering the concepts in this unit will give you a strong foundation for both the RBT exam and your future work in the field of behavioral therapy, autism support, and ABA services.
RBT Task A-1: Prepare for Data Collection
Every ABA session begins with preparation. As an RBT, you must be ready to collect data on target behaviors and skill acquisition goals throughout your time with the client.
Before each session:
- Review the client’s behavior intervention plan (BIP) and skill programs.
- Identify which behaviors or skills you will be recording.
- Confirm the data collection method you’ll use (e.g., frequency, duration, interval recording).
- Gather necessary data collection tools, such as:
- Paper data sheets and pens (for manual tracking)
- Tablets or smartphones with electronic data systems (e.g., Catalyst, CentralReach)
- Clickers for counting behavior occurrences
- Timers for tracking duration, latency, and IRT
Pro Tip: Keep materials portable and accessible especially when working in naturalistic settings like the home, where you might move between rooms frequently.
RBT Task A-2: Implement Continuous Measurement Procedures
Continuous measurement involves capturing every instance of a target behavior during observation. This method is most effective when behaviors are discrete, observable, and occur at a manageable rate.
Types of Continuous Measurement:
- Count The simple number of behavior occurrences. Example: “Sarah initiated conversation 4 times during the 10-minute session.”
- Frequency / Rate Frequency is the total count; rate is count per unit of time. Example: “Tom completed 5 math problems in 10 minutes (0.5 problems per minute).”
- Duration How long a behavior lasts from start to finish. Example: “Ben tantrumed for 4 minutes.”
- Response Latency The time between the instruction (SD) and the start of the behavior. Example: “After the RBT said, ‘Sit down,’ Mia complied after 12 seconds.”
- Interresponse Time (IRT) The time between the end of one behavior and the start of the next. Example: “Liam shouted at 2:01 PM and again at 2:03 PM. The IRT is 2 minutes.”
RBT Task A-3: Implement Discontinuous Measurement Procedures
Discontinuous measurement methods sample behavior during intervals, rather than capturing every occurrence. This is often used in busy environments (e.g., classrooms) or when continuous tracking is not feasible.
Three Main Types of Discontinuous Measurement:
- Whole Interval Recording Mark “✔” if the behavior occurred for the entire interval. Example: “The client remained seated for all of a 5-minute interval.”
- Partial Interval Recording Mark “✔” if the behavior occurred at any point during the interval. Example: “Head banging occurred once during a 10-minute interval = mark ‘✔’.”
- Momentary Time Sampling Observe whether the behavior is happening at the end of each interval. Example: “At the end of each 5-minute block, the teacher notes if the student is on-task.”
These methods are helpful in group settings, and for high-frequency or extended-duration behaviors.
RBT Task A-4: Implement Permanent Product Recording Procedures
Permanent-product measurement involves evaluating the physical result of a behavior rather than observing it in real time.
Examples of Permanent Products:
- Completed worksheets
- Cleaned rooms
- Written assignments
- Number of dishes washed
Example: “A therapist measures task completion by counting how many puzzles the child finished.”
This method is great for task analysis, skill acquisition goals, and self-monitoring programs, as it allows review after the behavior has occurred.
RBT Task A-5: Enter Data and Update Graphs
After collecting data during your session, you’ll need to input the data into a system and update graphs that track client progress over time.
Most Common Graph in ABA:
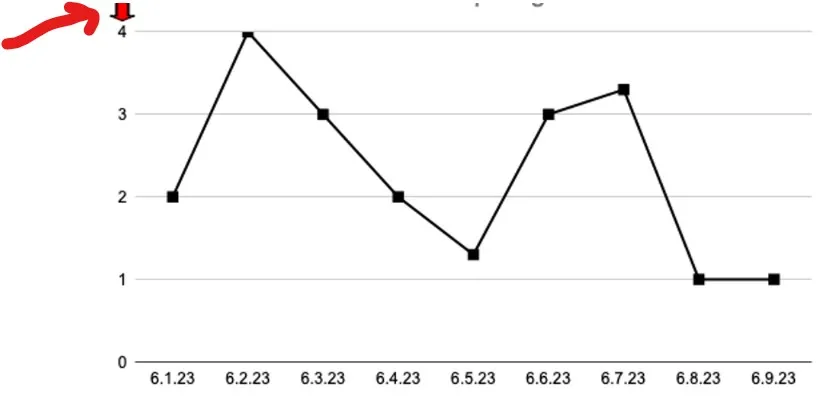
- Line Graph
- X-axis (horizontal) = session dates or numbers
- Y-axis (vertical) = behavioral metric (e.g., frequency, rate, duration)
Graphs help BCBAs make data-driven decisions, adjust interventions, and evaluate the effectiveness of treatment.
You may use:
- Handwritten graphs
- Excel/Google Sheets
- ABA software with auto-generated visuals (e.g., Rethink, ABA Matrix)
RBT Task A-6: Describe Behavior and Environment in Observable and Measurable Terms
Precision matters in ABA. All behavior descriptions must be:
- Observable – Can it be seen or heard?
- Measurable – Can it be counted or timed?
Avoid vague terms like “defiant,” “hyper,” or “non-compliant”
Use specific language:
- “Client screamed for 2 minutes after instruction.”
- “Client dropped to the floor when told to line up.”
Use the Dead Man’s Test: If a dead person can do it, it’s not a behavior. (E.g., being quiet isn’t a behavior but talking is.)
Describing behaviors clearly ensures:
- Consistent data collection
- Accurate communication with your team
- Ethical and objective reporting
Why Measurement Is the Backbone of ABA
Effective behavior measurement is not just about passing the RBT exam—it’s about delivering meaningful, ethical, and impactful therapy to clients. Your role in collecting reliable data directly informs how treatment plans evolve and how success is defined.
By mastering Section A of the RBT Task List, you are building the essential skills needed to:
- Track and analyze behavioral trends
- Collaborate effectively with BCBAs
- Ensure high-quality, evidence-based intervention